
TL;DR: The hallmarks of aging are a widely used map in aging biology: nine in 2013, twelve in 2023. Every hallmark must pass three criteria, but the evidence for two of those criteria comes mostly from animals. This map is good for finding your bearings; it is not a prescription. When you encounter the claim that “improving a hallmark means anti-aging,” ask three things: which hallmark was improved, what species supplied the evidence, and whether the endpoint was a biomarker or an actual health outcome.
In 2013, five European researchers published a review in Cell that organized the then-scattered field of aging research into nine “tentative” hallmarks. A decade later, the same group published a follow-up expanding the list to twelve, titled “An Expanding Universe.”
Those two papers have since been cited extensively, becoming a standard framework in aging research and a vocabulary that the anti-aging industry has borrowed freely. Some supplement brands, medical aesthetics clinics, and longevity centers now describe their offerings as “targeting the hallmarks” or “reversing hallmarks.”
When an academic framework gets used this widely, it is worth asking: what was this map originally drawn to show? What questions can it answer, and which ones can it not?
What Are the Twelve Hallmarks?
The 2023 version lists twelve: genomic instability, telomere attrition, epigenetic alterations, loss of proteostasis, disabled macroautophagy, deregulated nutrient sensing, mitochondrial dysfunction, cellular senescence, stem cell exhaustion, altered intercellular communication, chronic inflammation, and dysbiosis.
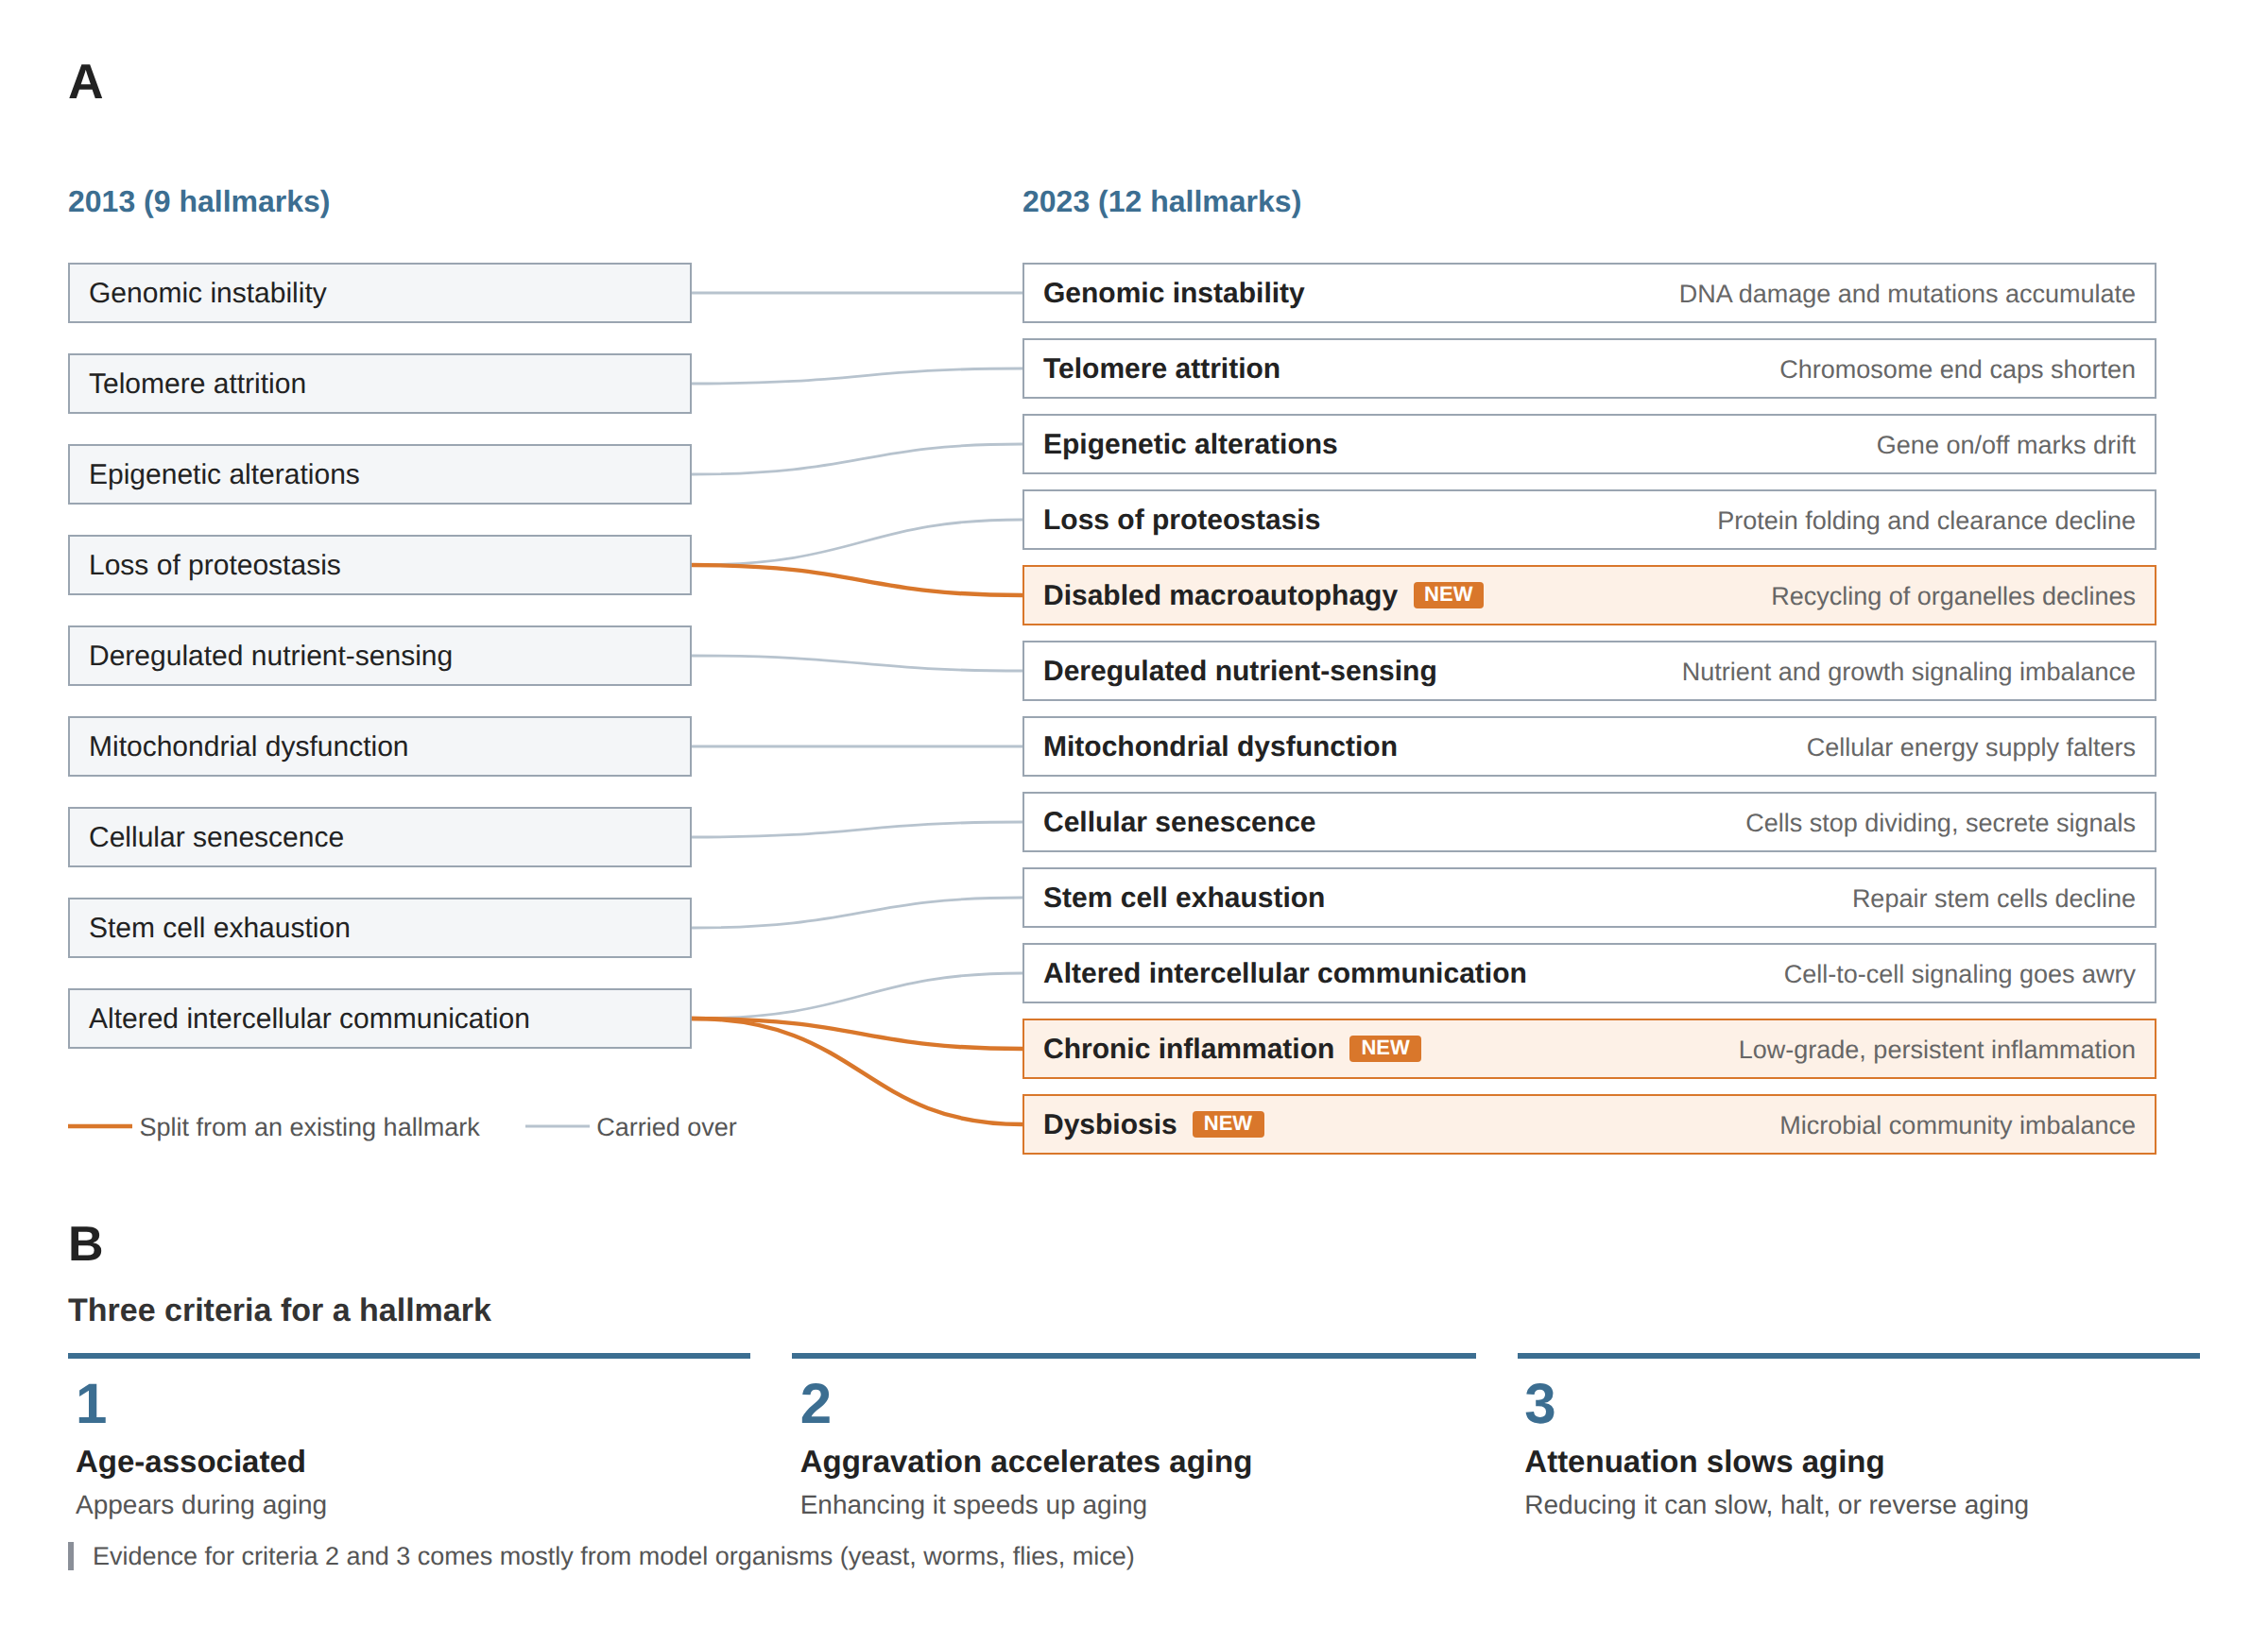
Figure 1. The twelve hallmarks of aging. (A) How the nine hallmarks of the 2013 paper became twelve in 2023. Orange lines mark the three new entries split from existing ones; a plain-language description accompanies each. (B) The three conditions a change must satisfy to be listed as a hallmark. Criteria 2 and 3 are supported mostly by evidence from model organisms. Source: López-Otín et al., Cell 2013 and 2023. This figure was redrawn from the original text and is not the authors’ figure.
The list itself is not hard to learn. What matters is the entry criteria. The authors require each hallmark to satisfy three conditions:
- It appears with age.
- Experimentally amplifying it accelerates aging.
- Intervening to reduce it can slow, halt, or even reverse aging.
The first condition is observational. The second and third are causal. Together, the three conditions mean the hallmarks are not simply a checklist of “things you see in old organisms”: they are a set of claims that these changes are driving aging.
The authors also arrange the twelve into three tiers: upstream hallmarks that cause damage, intermediate hallmarks that represent the body’s response to that damage (protective in small doses, harmful in excess), and integrative hallmarks at the downstream end where tissue and organ function begins to fail. This tiering is a causal narrative: damage first, response in the middle, functional decline at the end.
Where Did the Three New Hallmarks Come From?
The three additions in 2023 were not invented from scratch. Each was split out from an existing entry.
Disabled macroautophagy had been nested under loss of proteostasis. The authors concluded that macroautophagy processes whole organelles and non-protein macromolecules, not just misfolded proteins, so its scope goes beyond proteostasis. It earned its own line.
Chronic inflammation and dysbiosis were separated from altered intercellular communication, which the authors felt had grown too broad to be useful as a single category.
This history makes one thing clear: the number of hallmarks is a consequence of how the evidence is organized, not a fixed constant in nature. Over a decade, the same team revised their own classification. The number could change again.
The authors also emphasize throughout that the hallmarks are deeply interdependent. Amplifying or reducing one in an experiment typically moves others as well. That point will matter when we get to evaluating anti-aging claims.
Why Is Proteostasis Particularly Well-Suited to Being Examined Through Data?
Of the twelve hallmarks, this article pauses longest at loss of proteostasis.
Proteins must fold into precise three-dimensional shapes to function. Cells maintain an elaborate quality-control network to keep them that way: chaperones assist folding, the ubiquitin-proteasome system dismantles damaged proteins, and autophagy handles larger-scale clearance. A 2019 review in Nature Reviews Molecular Cell Biology assembled evidence that this network deteriorates with age: misfolded proteins tend to aggregate into potentially toxic clumps, and neurons, which no longer divide, are especially vulnerable.
Proteostasis has a practical advantage: it can be measured at scale. Thousands of proteins circulate in blood, and current platforms can quantify hundreds to thousands of them in a single run. Given enough samples, machine learning can find patterns.
A 2024 paper in Nature Medicine used plasma data from 45,441 UK Biobank participants to build an aging clock from 2,897 proteins. The final model used 204 proteins; 20 of those alone captured roughly 95% of the full model’s age-prediction performance. Participants whose “protein age” ran older than their chronological age faced higher subsequent risks of multiple chronic diseases and death. The team validated the age-prediction accuracy in an independent Chinese sample (the Kadoorie Biobank) and in FinnGen.
A 2023 paper in Nature took a different angle, attempting to decompose aging to the level of individual organs. The study drew on five cohort studies totaling 5,676 participants. The team trained separate protein-age models for eleven organs using 1,398 healthy participants, then tested them in the remaining cohorts. Roughly 18% of participants showed one organ aging markedly faster than the rest; about 1.7% showed accelerated aging across multiple organs simultaneously. In one cohort, each standard-deviation increase in cardiac protein age (roughly 4.1 years) was associated with a hazard ratio of 2.37 for subsequent heart failure: though that estimate came from 812 participants and only 26 heart failure events, a small base.
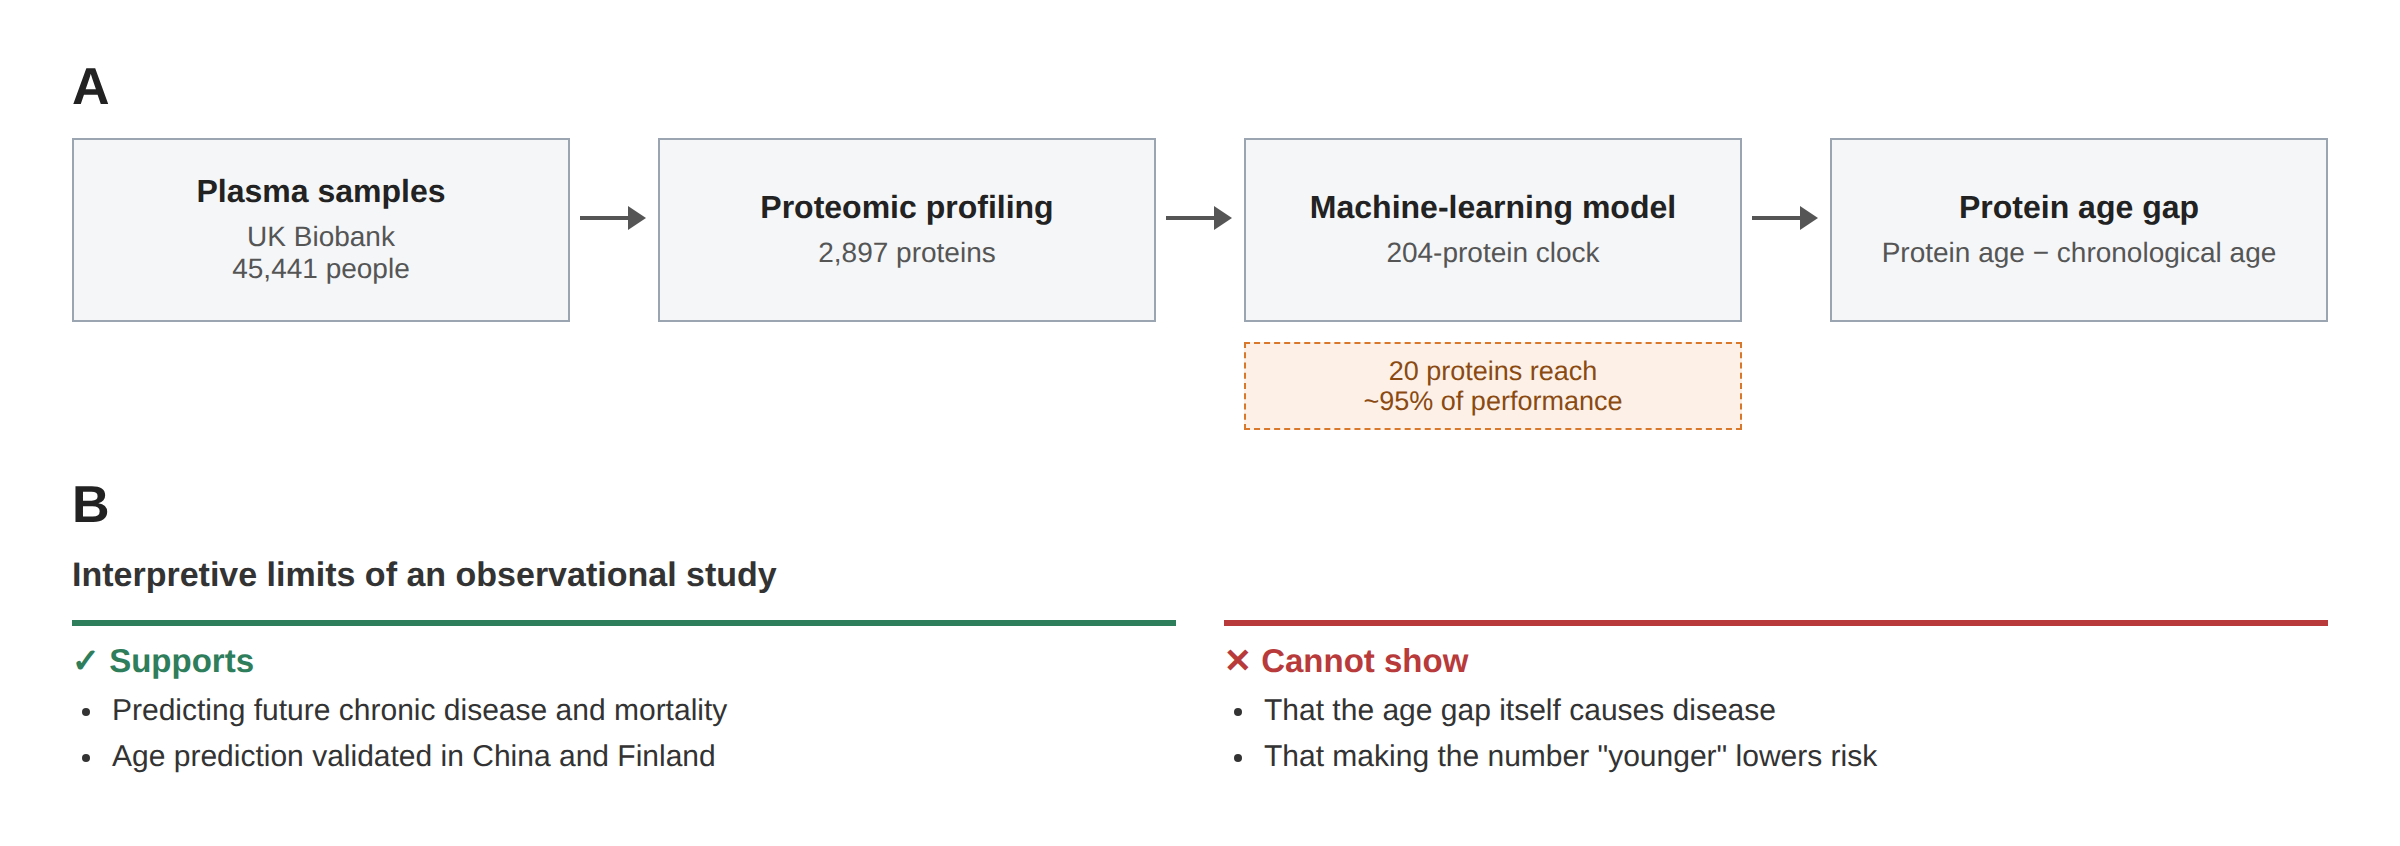
Figure 2. Building and interpreting a plasma proteomic aging clock. (A) The modeling pipeline from Argentieri et al., 2024. (B) The interpretive limits of observational research: a clock can predict risk; it cannot establish causation. Source: Argentieri et al., Nature Medicine 2024. Redrawn from original data; not the authors’ figure.
Table 1. Two plasma proteomic aging studies compared
| Item | Argentieri et al., 2024 | Oh et al., 2023 |
|---|---|---|
| Journal | Nature Medicine | Nature |
| Sample | 45,441 UK Biobank for modeling; 3,977 Chinese Kadoorie Biobank + 1,990 FinnGen for validation | Five cohort studies, 5,676 total; 1,398 used to train models |
| What was built | A whole-body aging clock using 204 of 2,897 proteins | Separate protein-age models for 11 organs |
| Main finding | 20 proteins reach ~95% of full-model age prediction; elevated protein age predicts risk of multiple chronic diseases and mortality | ~18% of individuals show one markedly older organ; ~1.7% show multiple older organs |
| Notable limitations | Chinese and Finnish samples primarily validated age prediction; disease and mortality associations largely from UK Biobank alone | HR 2.37 for heart failure from 812 participants, 26 events; cohorts predominantly US-based |
| Nature of evidence | Observational predictive model | Observational predictive model |
These two studies show that aging-associated protein changes are becoming something quantifiable: a measurable signal that can be used to forecast risk. This is the data-and-AI angle this series will keep returning to.
One distinction matters here. An aging clock makes predictions. It tells us that people whose protein age runs old tend to get sick more often later. It does not show that lowering someone’s protein age will prevent illness. Moving from prediction to causation requires intervention trials: not a more accurate clock.
What Do the Critics Say?
The framework has its critics. One piece cited frequently is a 2021 commentary by David Gems at University College London and aging genomics researcher João Pedro de Magalhães, titled “The Hoverfly and the Wasp.”
The hoverfly wears yellow-and-black stripes that mimic a wasp’s warning coloration, predators keep their distance, even though the hoverfly has no sting. The two authors use this analogy to argue that the hallmarks of aging borrow the external form of the cancer hallmarks, and look like a mature research paradigm, but the cancer hallmarks rest on a causal spine, genetic mutations producing disease through specifiable mechanisms: that the aging hallmarks have not yet matched.
Their specific objections: the causal relationships implied by “upstream hallmarks causing downstream ones” have not been demonstrated in many cases; the entries selected reflect, to some degree, which research areas were fashionable and well-funded at the time; and the framework does not connect strongly to how specific age-related diseases actually develop.
They did not dismiss the framework outright. The commentary acknowledges it as a valuable survey of aging biology, and notes it is useful for identifying interventions that might affect multiple hallmarks simultaneously.
In 2025, de Magalhães published a review in Nature Cell Biology that organized contemporary aging theories into two broad camps, error accumulation versus programmed aging, and concluded that the field still needs a more rigorous theoretical foundation.
So the two positions are: the original authors hold that the hallmarks drive aging; the critics argue the causal claim has not been adequately demonstrated. Both sides agree it is a useful overview. The disagreement is whether it has yet earned the same causal explanatory power as the cancer hallmarks.
Three Questions to Ask When You See an “Improved Hallmark” Claim
Back to those “targeting the hallmarks” marketing claims. By “anti-aging,” I mean extending human healthspan or reducing age-related disease: not a biomarker moving in a favorable direction. With that definition in place, three questions are worth asking:
First, which hallmark was improved? The hallmarks are highly interdependent. Changing one may improve others, leave them unchanged, or even worsen them. A report on a single hallmark does not reveal the full picture.
Second, what species provided the evidence? Two of the three entry criteria, amplification accelerates aging, reduction slows it, are supported mostly by evidence from yeast, nematodes, fruit flies, and mice. Interventions that extend lifespan in mice do not reliably translate to humans.
Third, is the endpoint a biomarker or a health outcome? If the evidence shows only that a biological marker improved, or that an aging clock reading went down, the claim is still at the prediction level. Saying people will actually be healthier requires human trials with disease or function as the endpoint.
Arranged as a ladder, these questions show exactly where the inferential leap tends to happen:
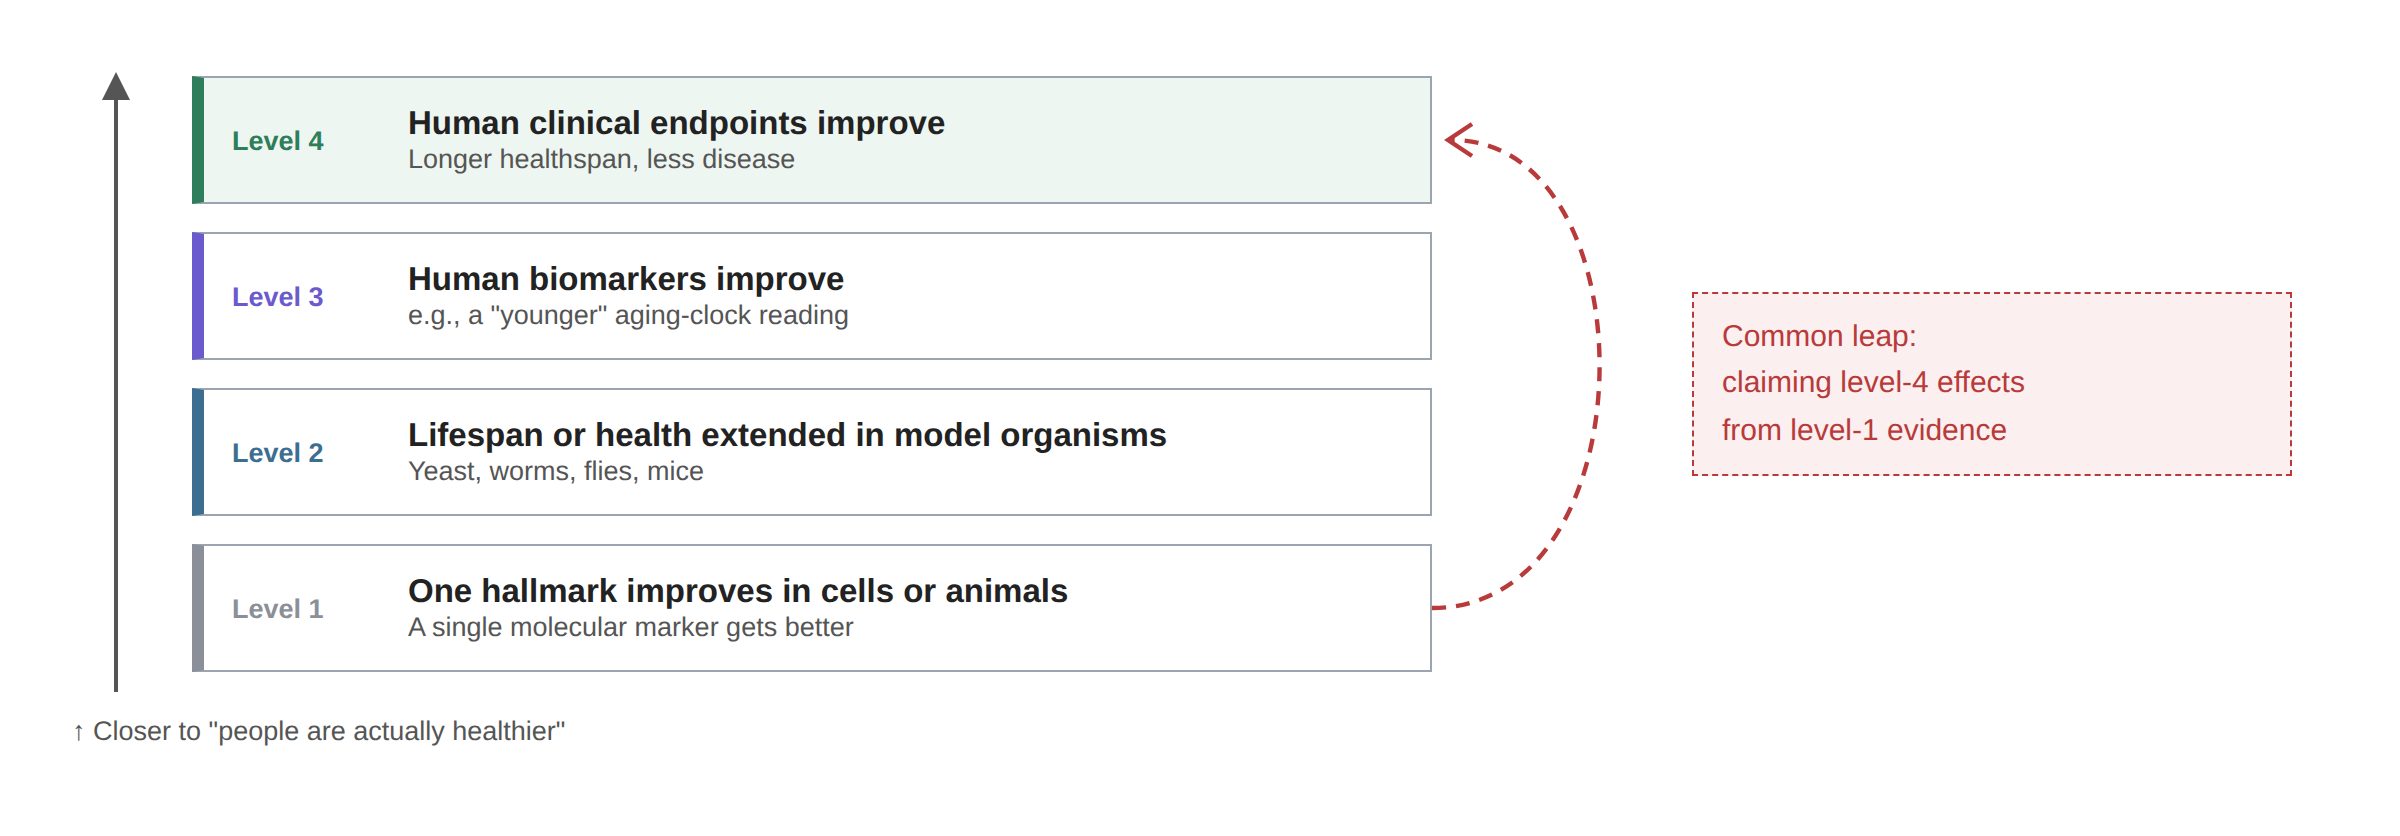
Figure 3. The evidence ladder from “improving a hallmark” to “human anti-aging.” Higher rungs bring the evidence closer to “humans are actually healthier.” The red dashed line marks the common leap: using first-rung evidence to claim a fourth-rung effect. Drawn as a conceptual figure based on the entry criteria in López-Otín et al., Cell 2023, and the framework critique in Gems and de Magalhães, 2021.
These three questions are not meant to dismiss anti-aging research. Some interventions are being studied with human clinical endpoints, and those deserve to be evaluated on their own evidence. What these questions filter out is the specific leap from “one hallmark improved” to “humans will age more slowly.”
Where This Series Goes Next
This is the first article in the “Molecules and Aging” series. The map is now open. Subsequent articles will walk into specific regions: how proteostasis research is conducted, senolytic drugs and the clearing of senescent cells, epigenetic reprogramming, and the signaling molecules that cells secrete.
The piece on cellular secretions will connect back to the “Regenerative Medicine” series article, “After Mesenchymal Stem Cells Enter the Vein, Where Do the Cells Actually Go?.” That article addresses where cells travel in the body and how they modulate the immune system. The proposed mechanisms differ, but the two topics are related.
The clearer the map, the easier it is to see where the blank spaces are.
What This Article Does Not Claim
- This article does not argue that the hallmarks of aging are wrong, or that research targeting a single hallmark has no value.
- This article does not evaluate any specific product, therapy, or provider.
- The aging clock studies cited are observational. This article does not treat them as evidence that any intervention is effective.
References
The Framework
- López-Otín C, Blasco MA, Partridge L, Serrano M, Kroemer G. The hallmarks of aging. Cell. 2013;153(6):1194–1217. PMID 23746838. https://doi.org/10.1016/j.cell.2013.05.039 (nine tentative hallmarks)
- López-Otín C, Blasco MA, Partridge L, Serrano M, Kroemer G. Hallmarks of aging: An expanding universe. Cell. 2023;186(2):243–278. PMID 36599349. https://doi.org/10.1016/j.cell.2022.11.001 (twelve hallmarks, three entry criteria, rationale for the new additions)
Critique and Theory
- Gems D, de Magalhães JP. The hoverfly and the wasp: A critique of the hallmarks of aging as a paradigm. Ageing Res Rev. 2021;70:101407. PMID 34271186. https://doi.org/10.1016/j.arr.2021.101407 (commentary)
- de Magalhães JP. An overview of contemporary theories of ageing. Nat Cell Biol. 2025;27(7):1074–1082. PMID 40595368. https://doi.org/10.1038/s41556-025-01698-7 (narrative review, single author)
Proteomics and Data
- Hipp MS, Kasturi P, Hartl FU. The proteostasis network and its decline in ageing. Nat Rev Mol Cell Biol. 2019;20(7):421–435. PMID 30733602. https://doi.org/10.1038/s41580-019-0101-y
- Argentieri MA, et al. Proteomic aging clock predicts mortality and risk of common age-related diseases in diverse populations. Nat Med. 2024;30(9):2450–2460. PMID 39117878. https://doi.org/10.1038/s41591-024-03164-7 (observational predictive model)
- Oh HS-H, et al. Organ aging signatures in the plasma proteome track health and disease. Nature. 2023;624(7990):164–172. PMID 38057571. https://doi.org/10.1038/s41586-023-06802-1 (observational study; HR 2.37 for heart failure from one cohort, 812 participants, 26 events)
Series: After Mesenchymal Stem Cells Enter the Vein, Where Do the Cells Actually Go?

💬 Comments
Loading...